I saw this tweet today
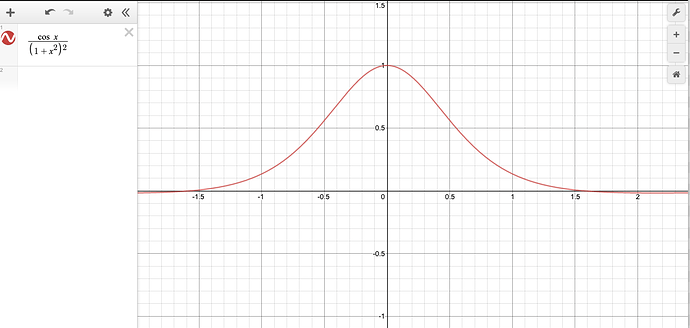
And was curious as to what the graph of that function looks like. You can tell that since it is a cosine, it will be sinusoidal and it will be 1 where x=0, but it will dampen out and tend to zero as x increases in either direction.
Back in the olden days when I was taking math courses I would then have to get out some graph paper and a calculator or maybe one of these fancy graphing calculators that the uber-nerds had. But today, you can find graphing calculators on line.
I just typed it in and it graphed it automatically.

You can zoom out and zoom in or change any of the parameters. Gee! I wish we’d have had stuff like this 25 years ago.
